

ดาวน์โหลด yaml จากลิงก์ จากนั้น config ไฟล์ promtail-config.yaml โดยใส่ docker container ที่ต้องการ monitor
# promtail-config.yaml
server:
  http_listen_port: 9080
  grpc_listen_port: 0

clients:
  - url: http://loki:3100/loki/api/v1/push

scrape_configs:
  - job_name: system
    static_configs:
      - targets:
          - localhost
        labels:
          job: system
          __path__: /var/log/*log
  - job_name: docker-app1
    static_configs:
      - targets:
          - localhost
        labels:
          job: docker-app1
          container_name: app1
          __path__: /var/lib/docker/containers/*/*.log
เช่น เพิ่ม job_name
- job_name: docker-nginx
    static_configs:
      - targets:
          - localhost
        labels:
          job: docker-nginx
          container_name: nginx
          __path__: /var/lib/docker/containers/*/*.log
เข้า grafana ผ่าน http:<ip>:3000
เลือก import dashboard ใส่ ID 13639
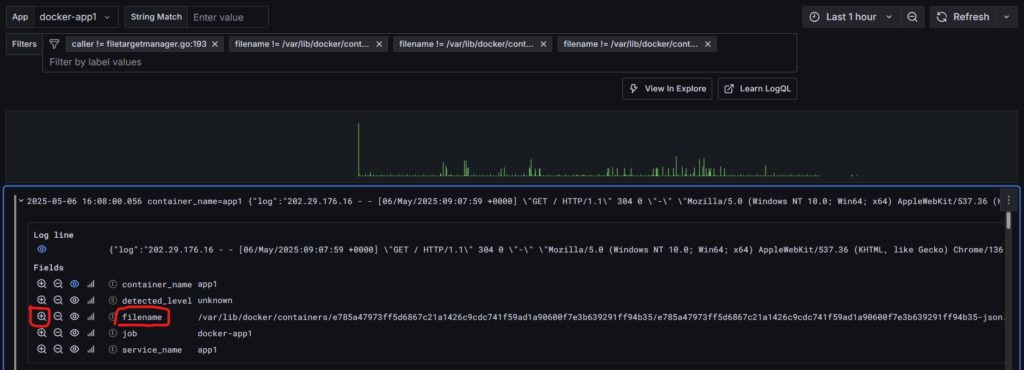
เลือก filter log จากรายการ log หรือ path ที่สนใจ